Historical snapshot: Alea Research’s analysis was published by TechFlow on November 12, 2026, at 09:57 (UTC+8). The figures below describe Q3 2026 and specified dates in October, not current market conditions.
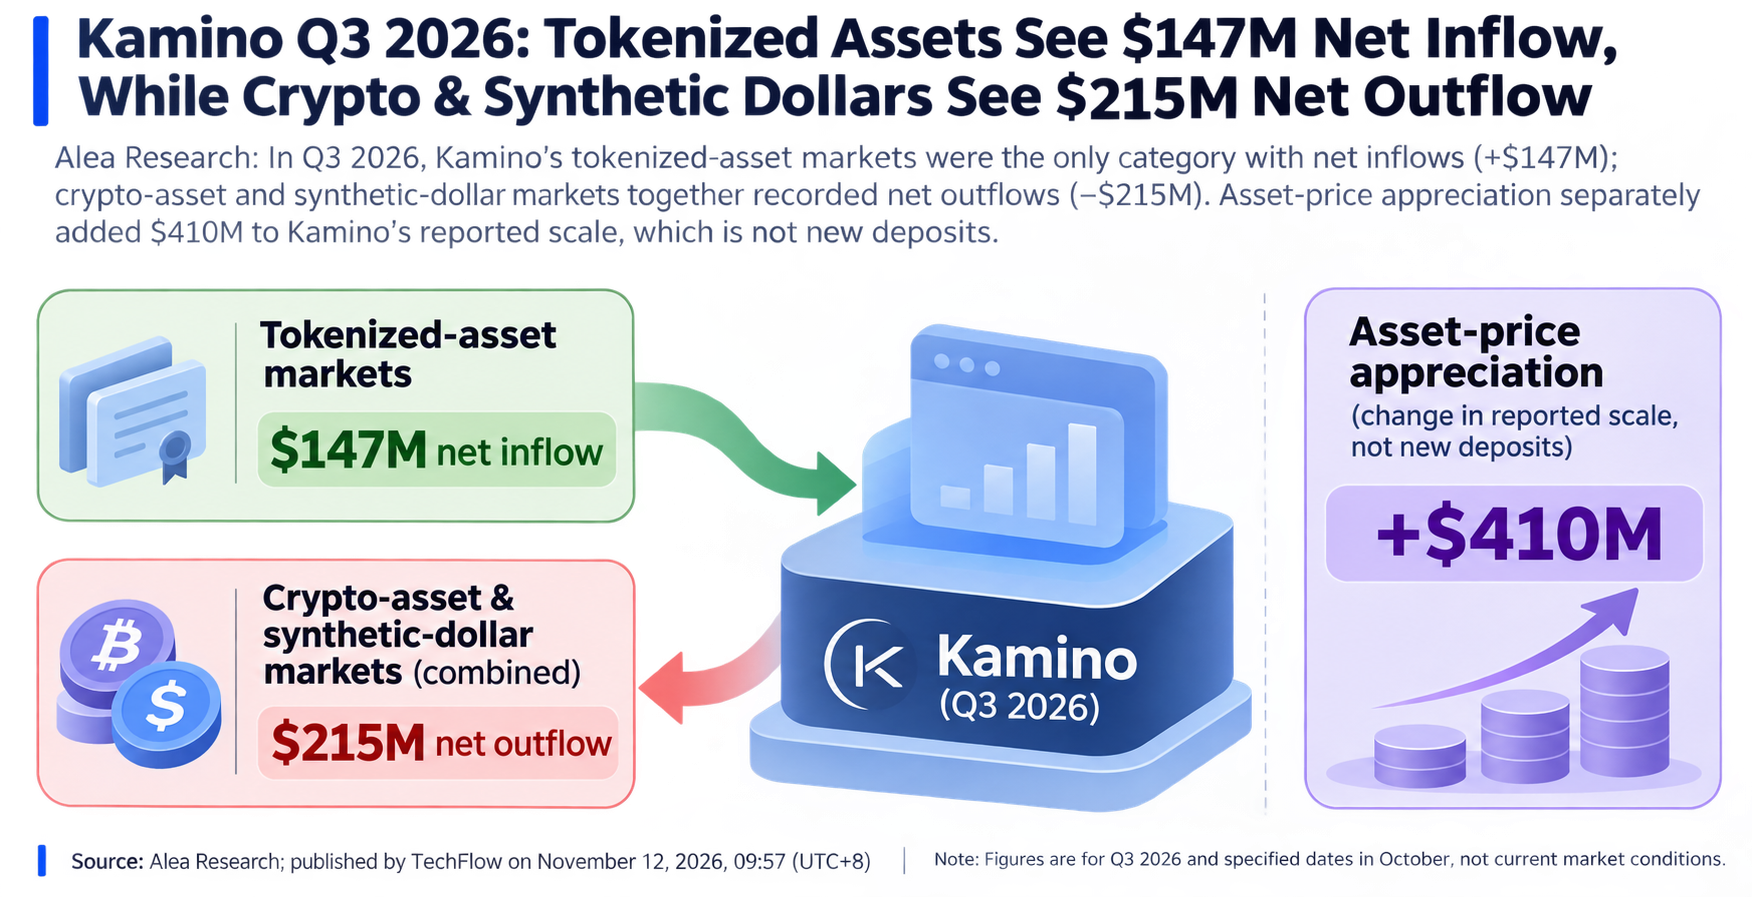
Kamino’s tokenized-asset markets recorded $147 million in net inflows in Q3 2026, according to Alea Research. They were the platform’s only market category with net inflows that quarter: its crypto-asset and synthetic-dollar markets together recorded $215 million in net outflows. Asset-price appreciation separately added $410 million to the platform’s reported scale; that change should not be confused with new deposits.
Where deposits went
Of the tokenized-asset inflows, $134 million went to 10 markets opened during Q3. Among dollar-collateral markets operating throughout the quarter, deposits in OnRe rose $92.5 million and those in Huma’s PST market rose $62.5 million. Figure’s PRIME market, by contrast, shrank $125.5 million. Alea Research described deposits as concentrating in markets with wider carry—the difference between collateral yield and borrowing cost—but that spread can change.
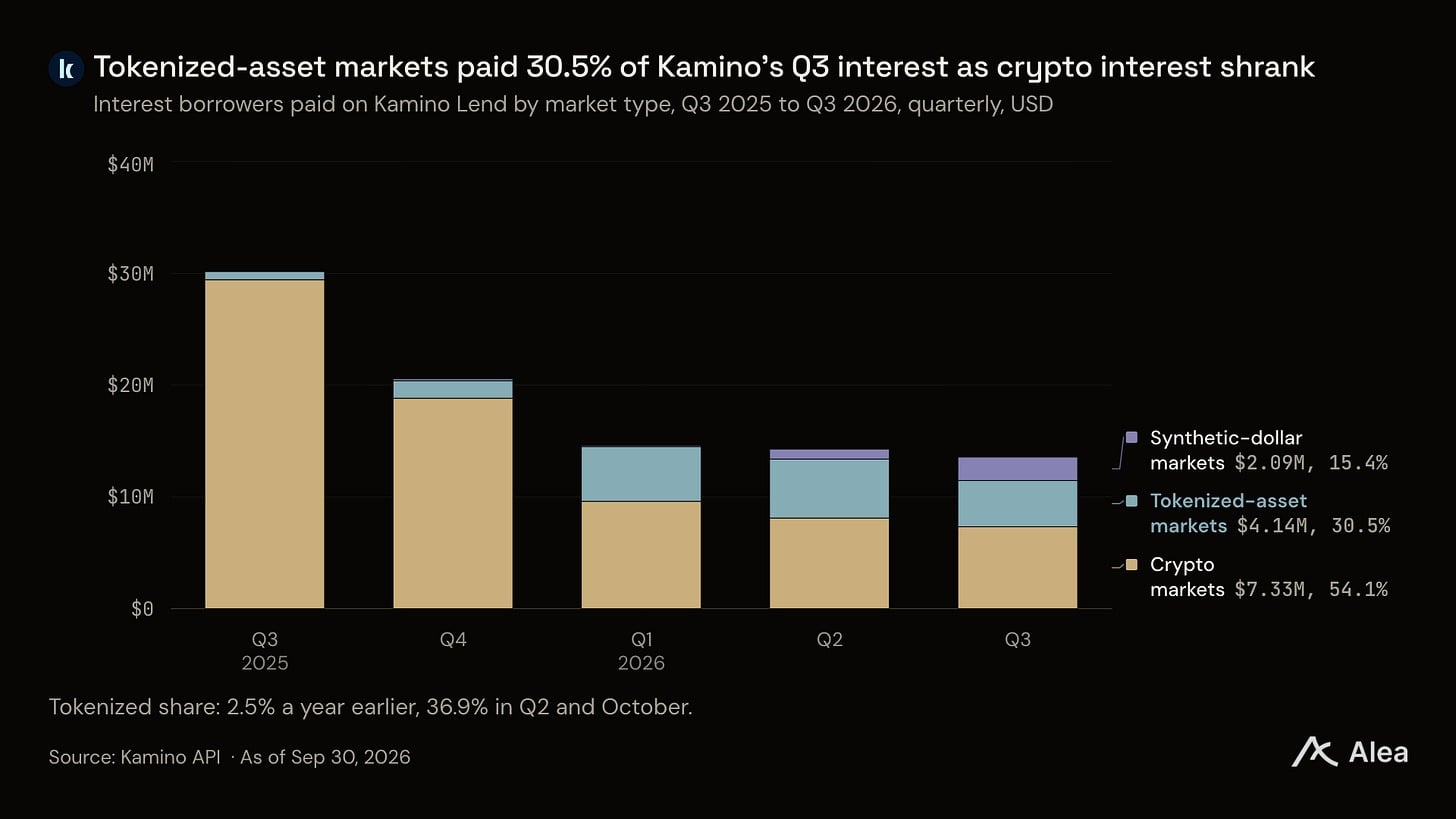
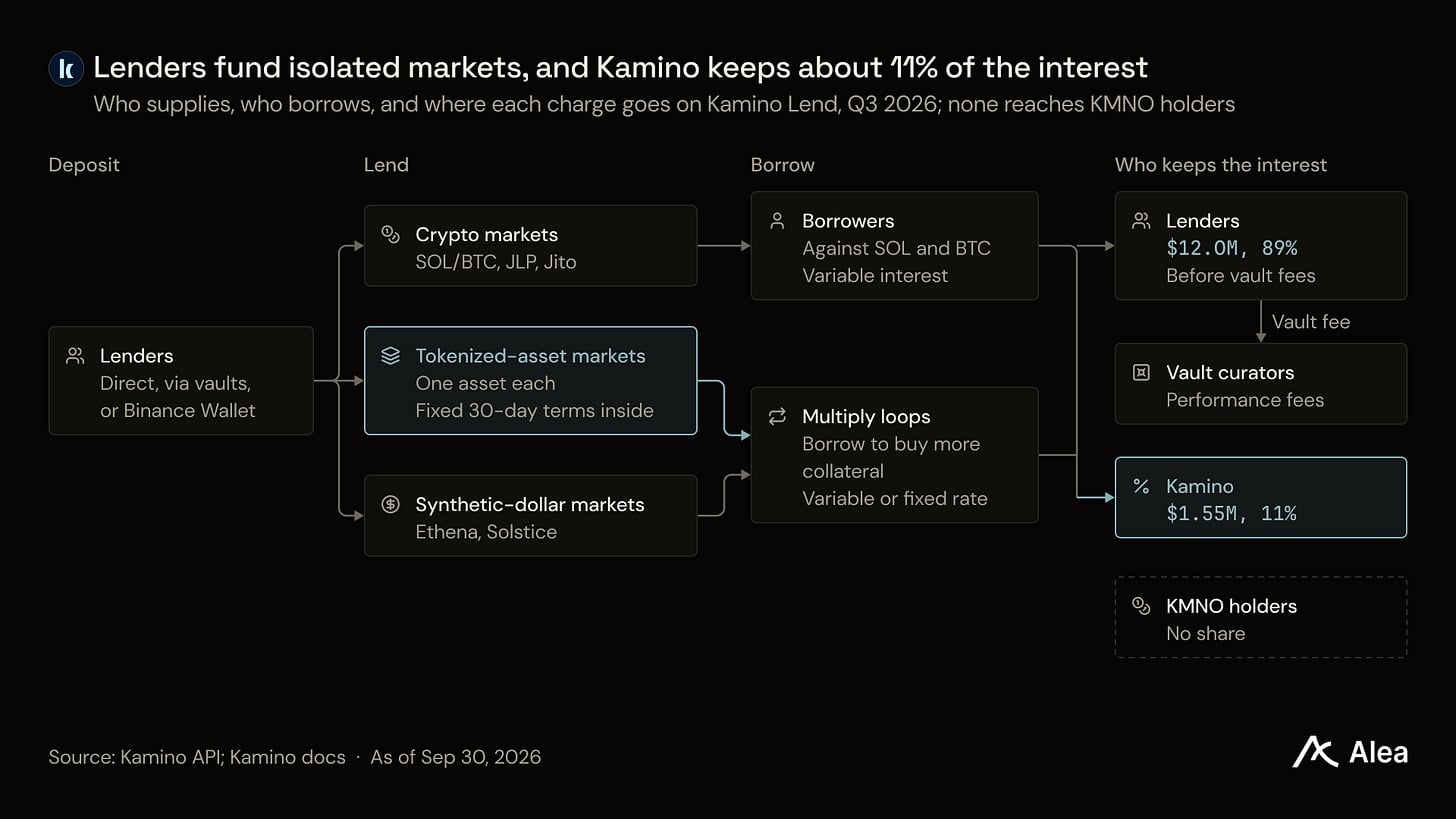
Tokenized-asset markets generated 30.5% of Kamino’s Q3 borrowing interest, compared with 2.5% a year earlier and 36.9% in Q2 2026. Kamino retained $1.55 million in protocol interest revenue in Q3, versus $1.61 million in Q2. The analysis says this revenue was not being distributed to KMNO holders.
Fixed-rate borrowing and its limits
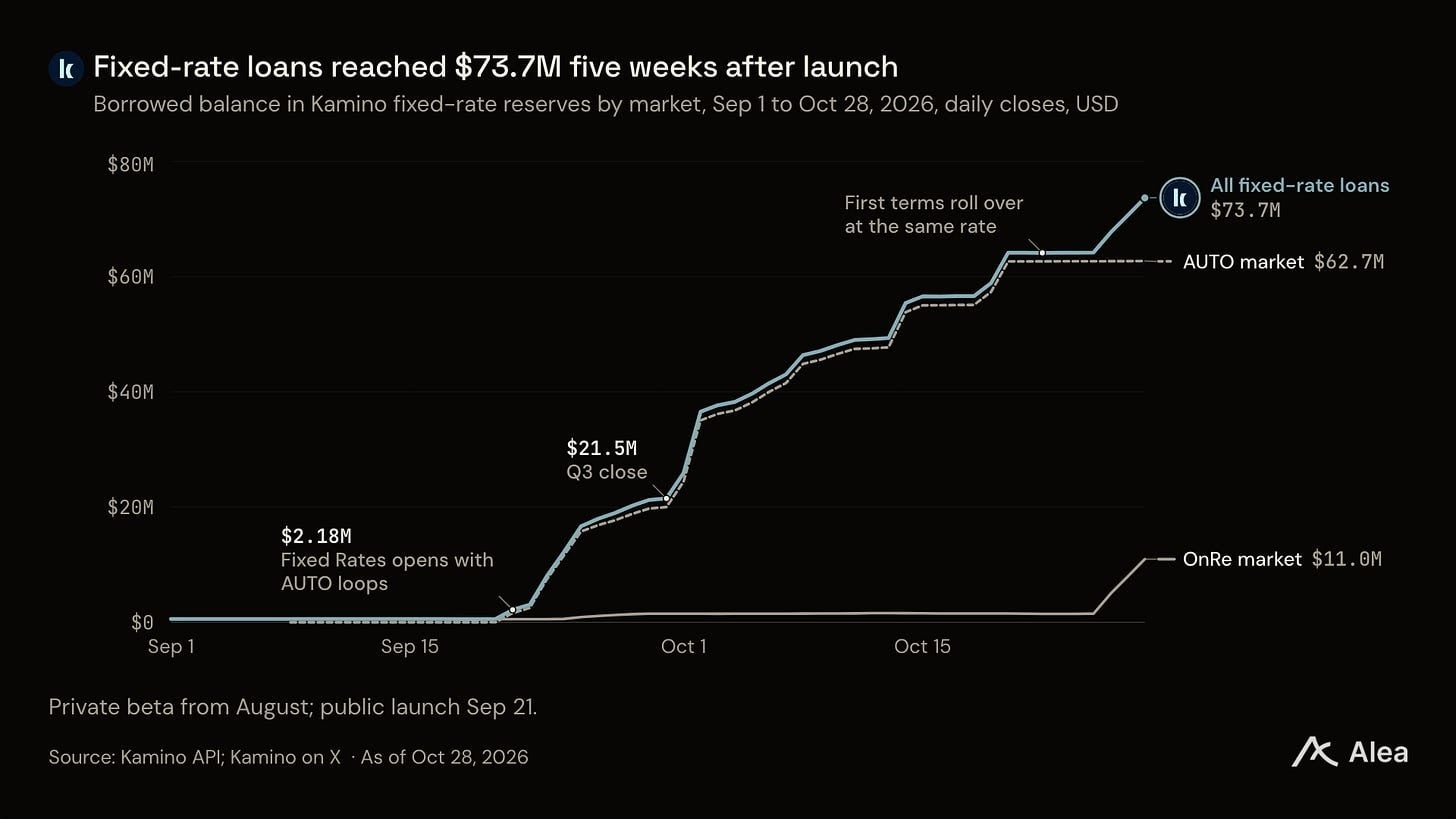
Kamino launched its fixed-rate borrowing feature on September 21, 2026. Outstanding fixed-rate loans reached $21.5 million on September 30 and $73.7 million by October 28. According to the analysis, an initial $12 million in loans rolled into another 30-day term at the same rate because lenders had not requested redemption.
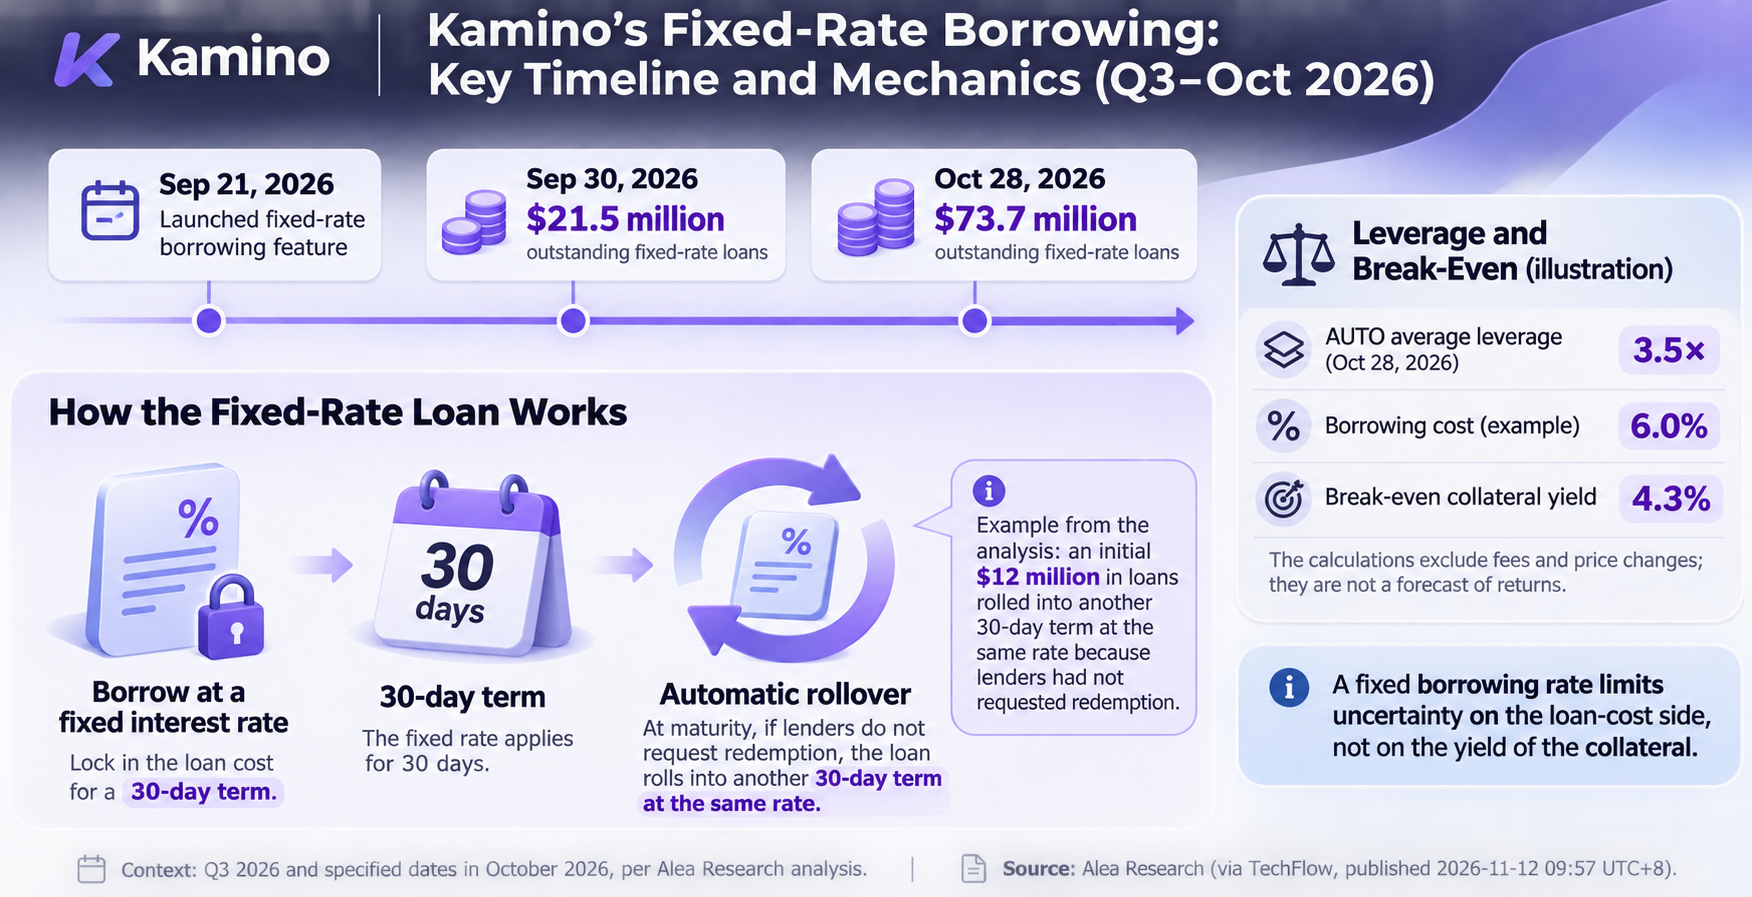
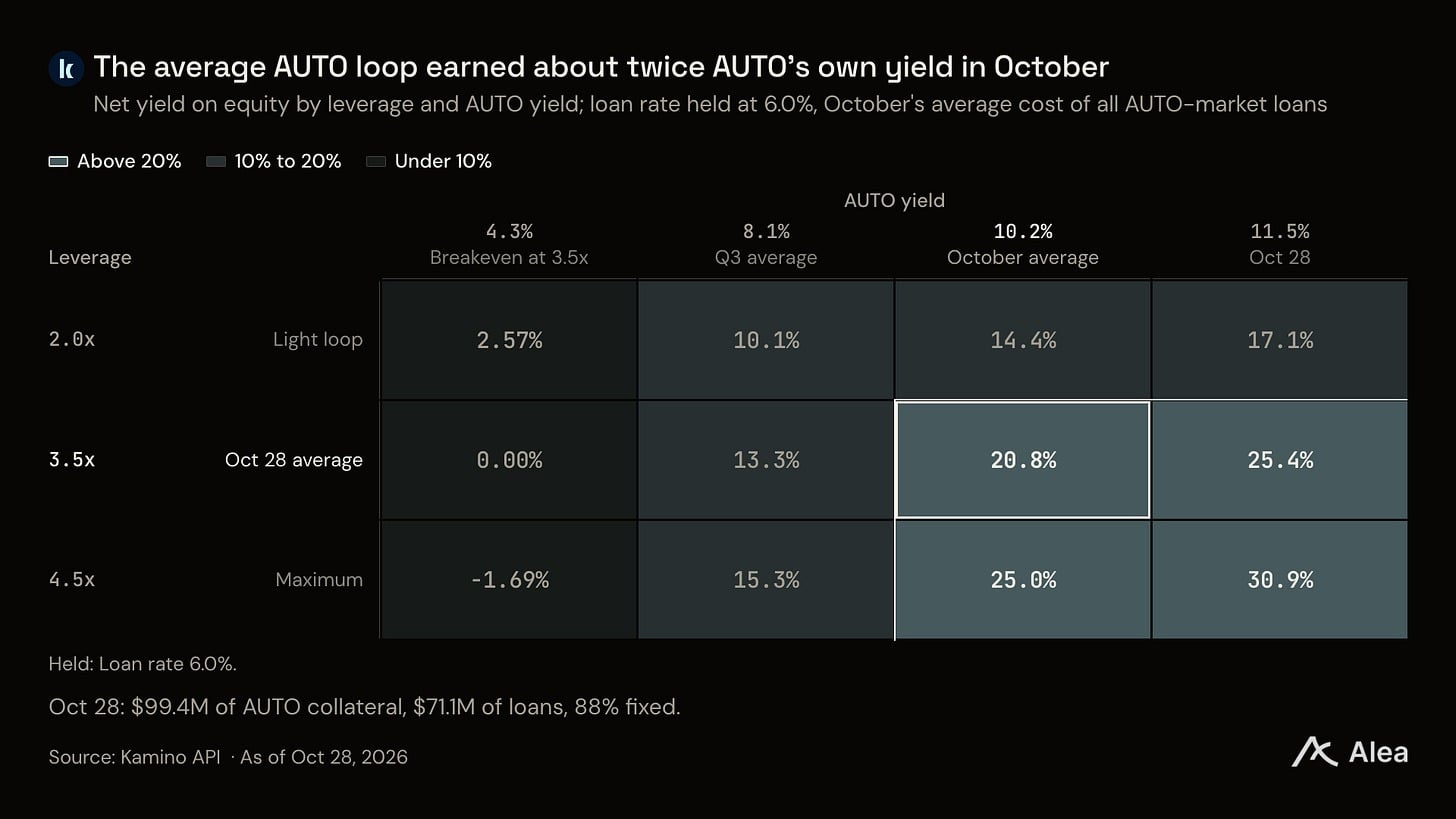
A fixed borrowing rate limits uncertainty on the loan-cost side, not on the yield of the collateral. Alea Research estimated that AUTO leveraged borrowing positions averaged 3.5 times leverage on October 28. In its illustration, a 6.0% borrowing cost implied a 4.3% break-even collateral yield. Those calculations exclude fees and price changes; they are not a forecast of returns.
Competitive context
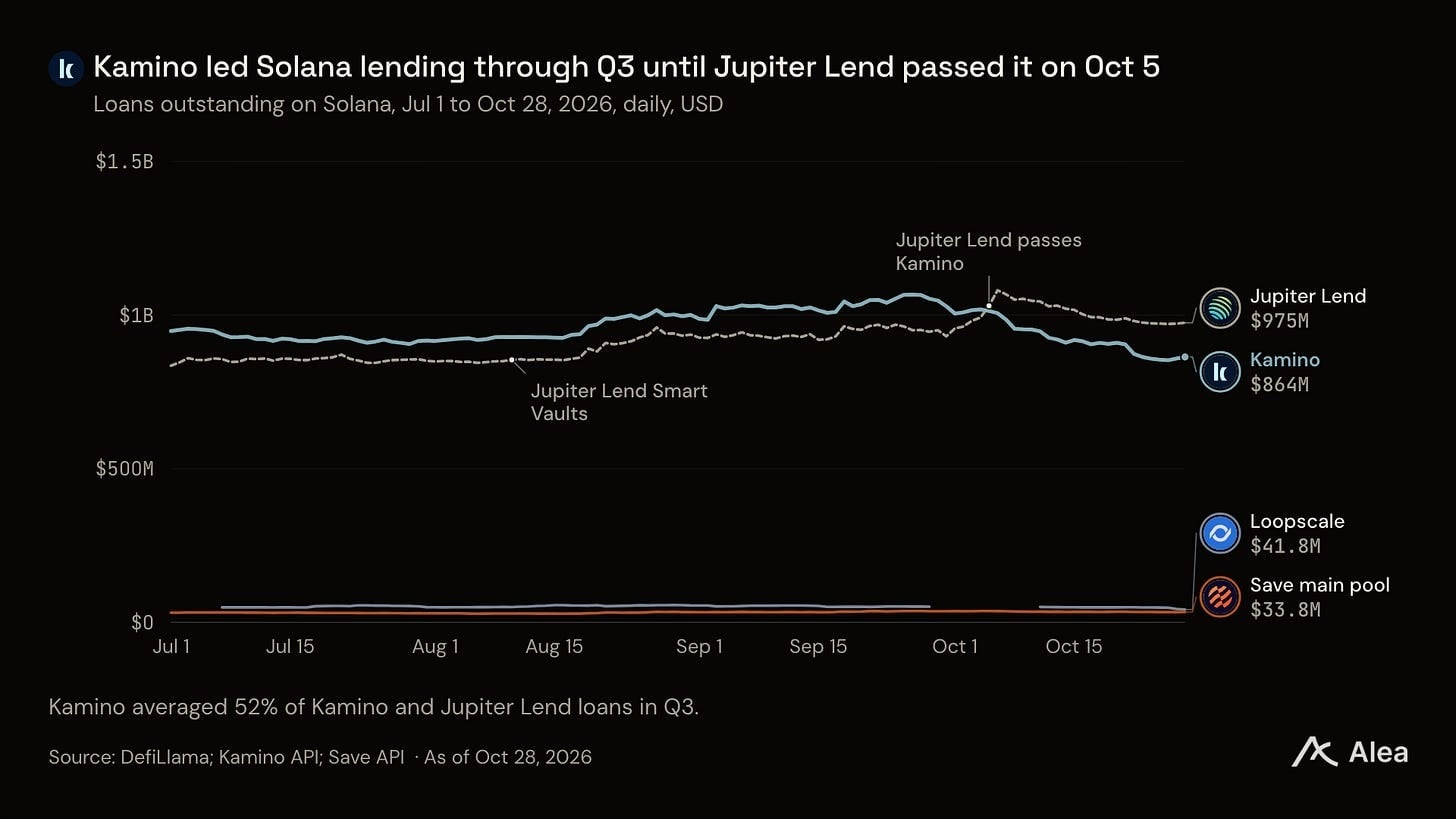
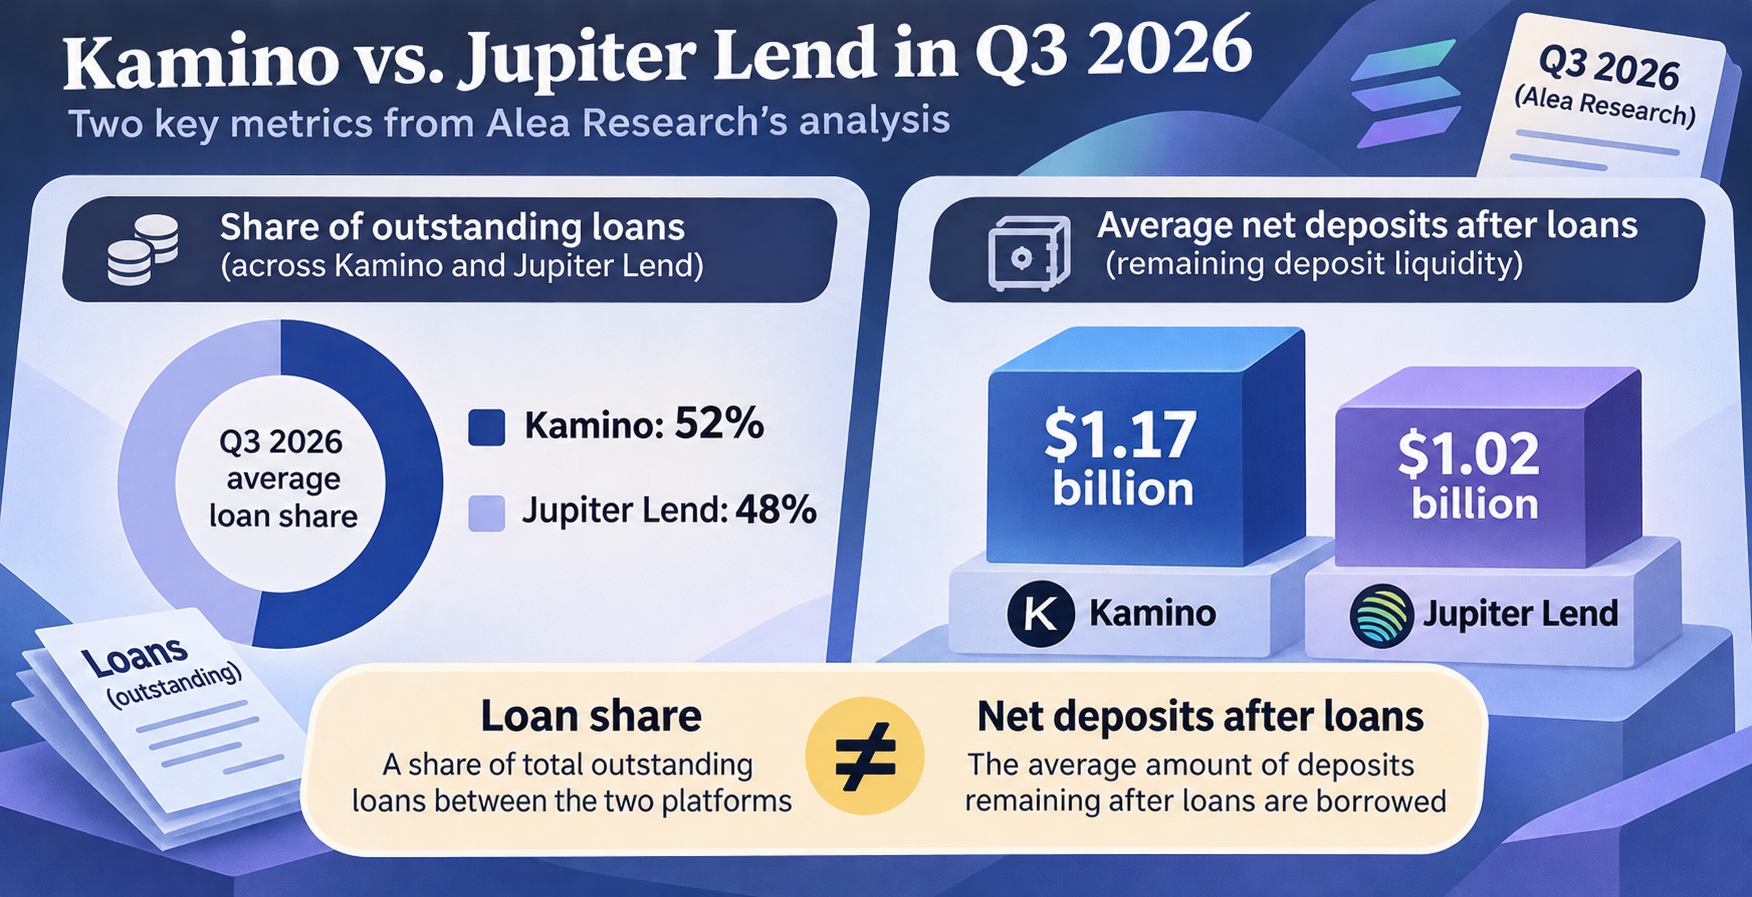
Kamino averaged 52% of outstanding loans across Kamino and Jupiter Lend in Q3, down from 58% in Q2, according to the analysis. Its Q3 average net deposits after loans were $1.17 billion, against Jupiter Lend’s $1.02 billion. Jupiter Lend overtook Kamino in total borrowing on October 5, illustrating why loan share and remaining deposit liquidity should be read as separate measures.