On 11 November 2026 at 09:55 (UTC+8), TechFlow published a briefing on Stablecoins in Commerce, the first report in a “Money in Motion” series from Glassnode and the payment gateway NOWPayments. The figures below are the ones that briefing reported. They describe windows ending in early October 2026, not a live reading and not a trade signal.
The piece separates two measurements. One is on-chain: how much stablecoin value moves between addresses. The other is commercial: what arrives at NOWPayments merchant checkouts. The reported condition is that those distributions do not match. The lead also says aggregate stablecoin market value had moved above $303 billion and that average daily on-chain stablecoin transfer value exceeded Bitcoin and Ethereum combined, while stating that on-chain value moved is not the same thing as a real commercial payment.
Transfer rank versus merchant receipts
TechFlow says that, for a business adding stablecoins, the token and the chain affect whether a customer can pay, what fees cost, and how hard reconciliation is. USDT and USDC account for most of the stablecoin market and both track the dollar, but the report describes sharply different use across chains, payment settings, and participant groups.
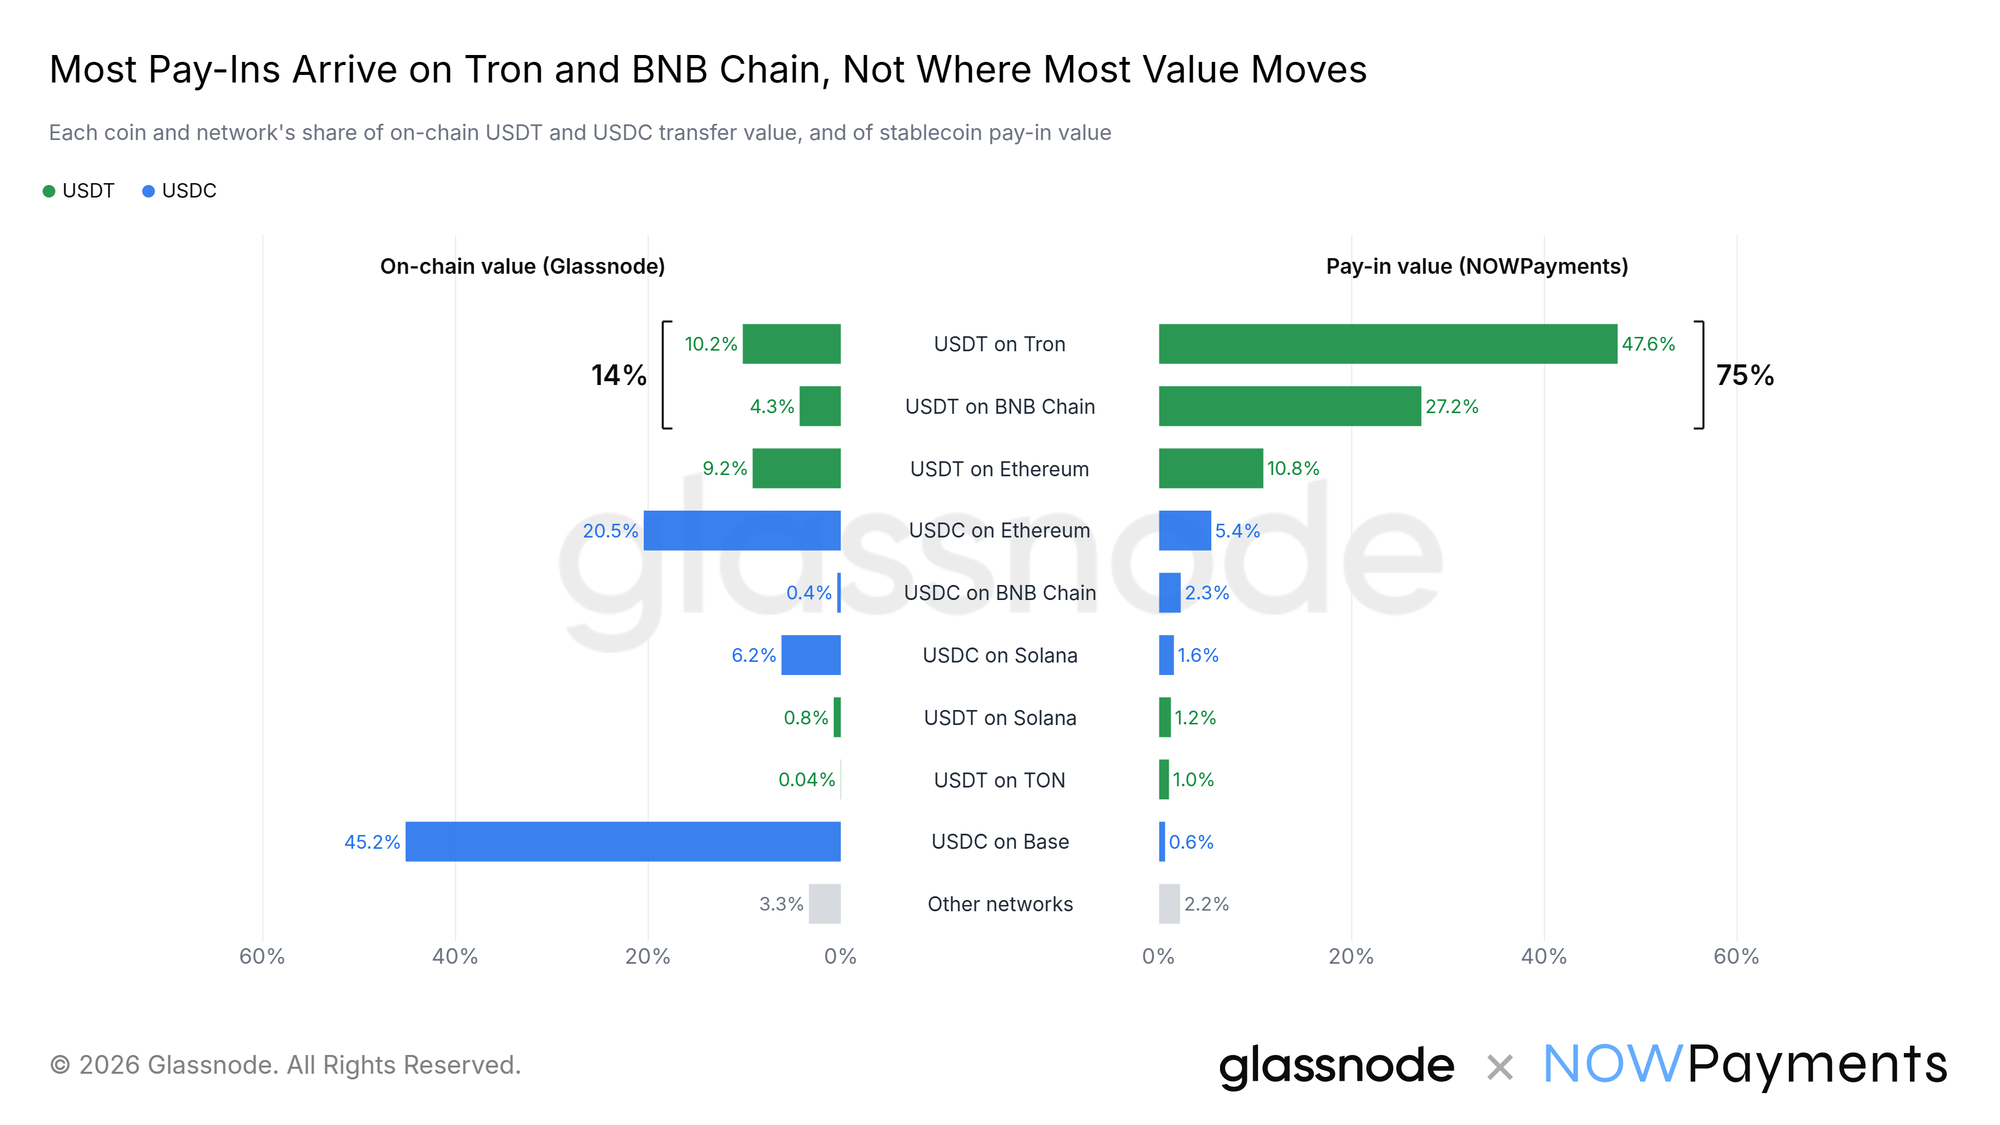
At the NOWPayments checkout, USDT on Tron, BNB Chain, and Ethereum together accounted for 86% of stablecoin receipt value. The three largest on-chain transfer combinations in the comparison — USDC on Base, USDC on Ethereum, and USDT on Tron — accounted for 54% of those merchant receipts. The report says that inferring merchant channels from the distribution of on-chain active addresses fitted the receipt pattern about twice as well as inferring them from transfer value alone.
Comparison window: September 2025 through September 2026. Metric: share of combined USDT and USDC on-chain transfer value, set against share of NOWPayments merchant receipt value.
- USDC on Base was 45.2% of that on-chain transfer value and 0.6% of merchant receipts.
- USDT on Tron and USDT on BNB Chain together were 14% of on-chain transfer value and 75% of merchant receipts.
The article’s comparison figure places chain-level on-chain shares on the left and NOWPayments receipt shares on the right for that window. In this gateway’s data, the rail with the largest transfer share is a very small receipt channel, while two smaller transfer rails take most of the commercial inflow. That is one processor’s checkout, not all stablecoin commerce.
When receipts arrived
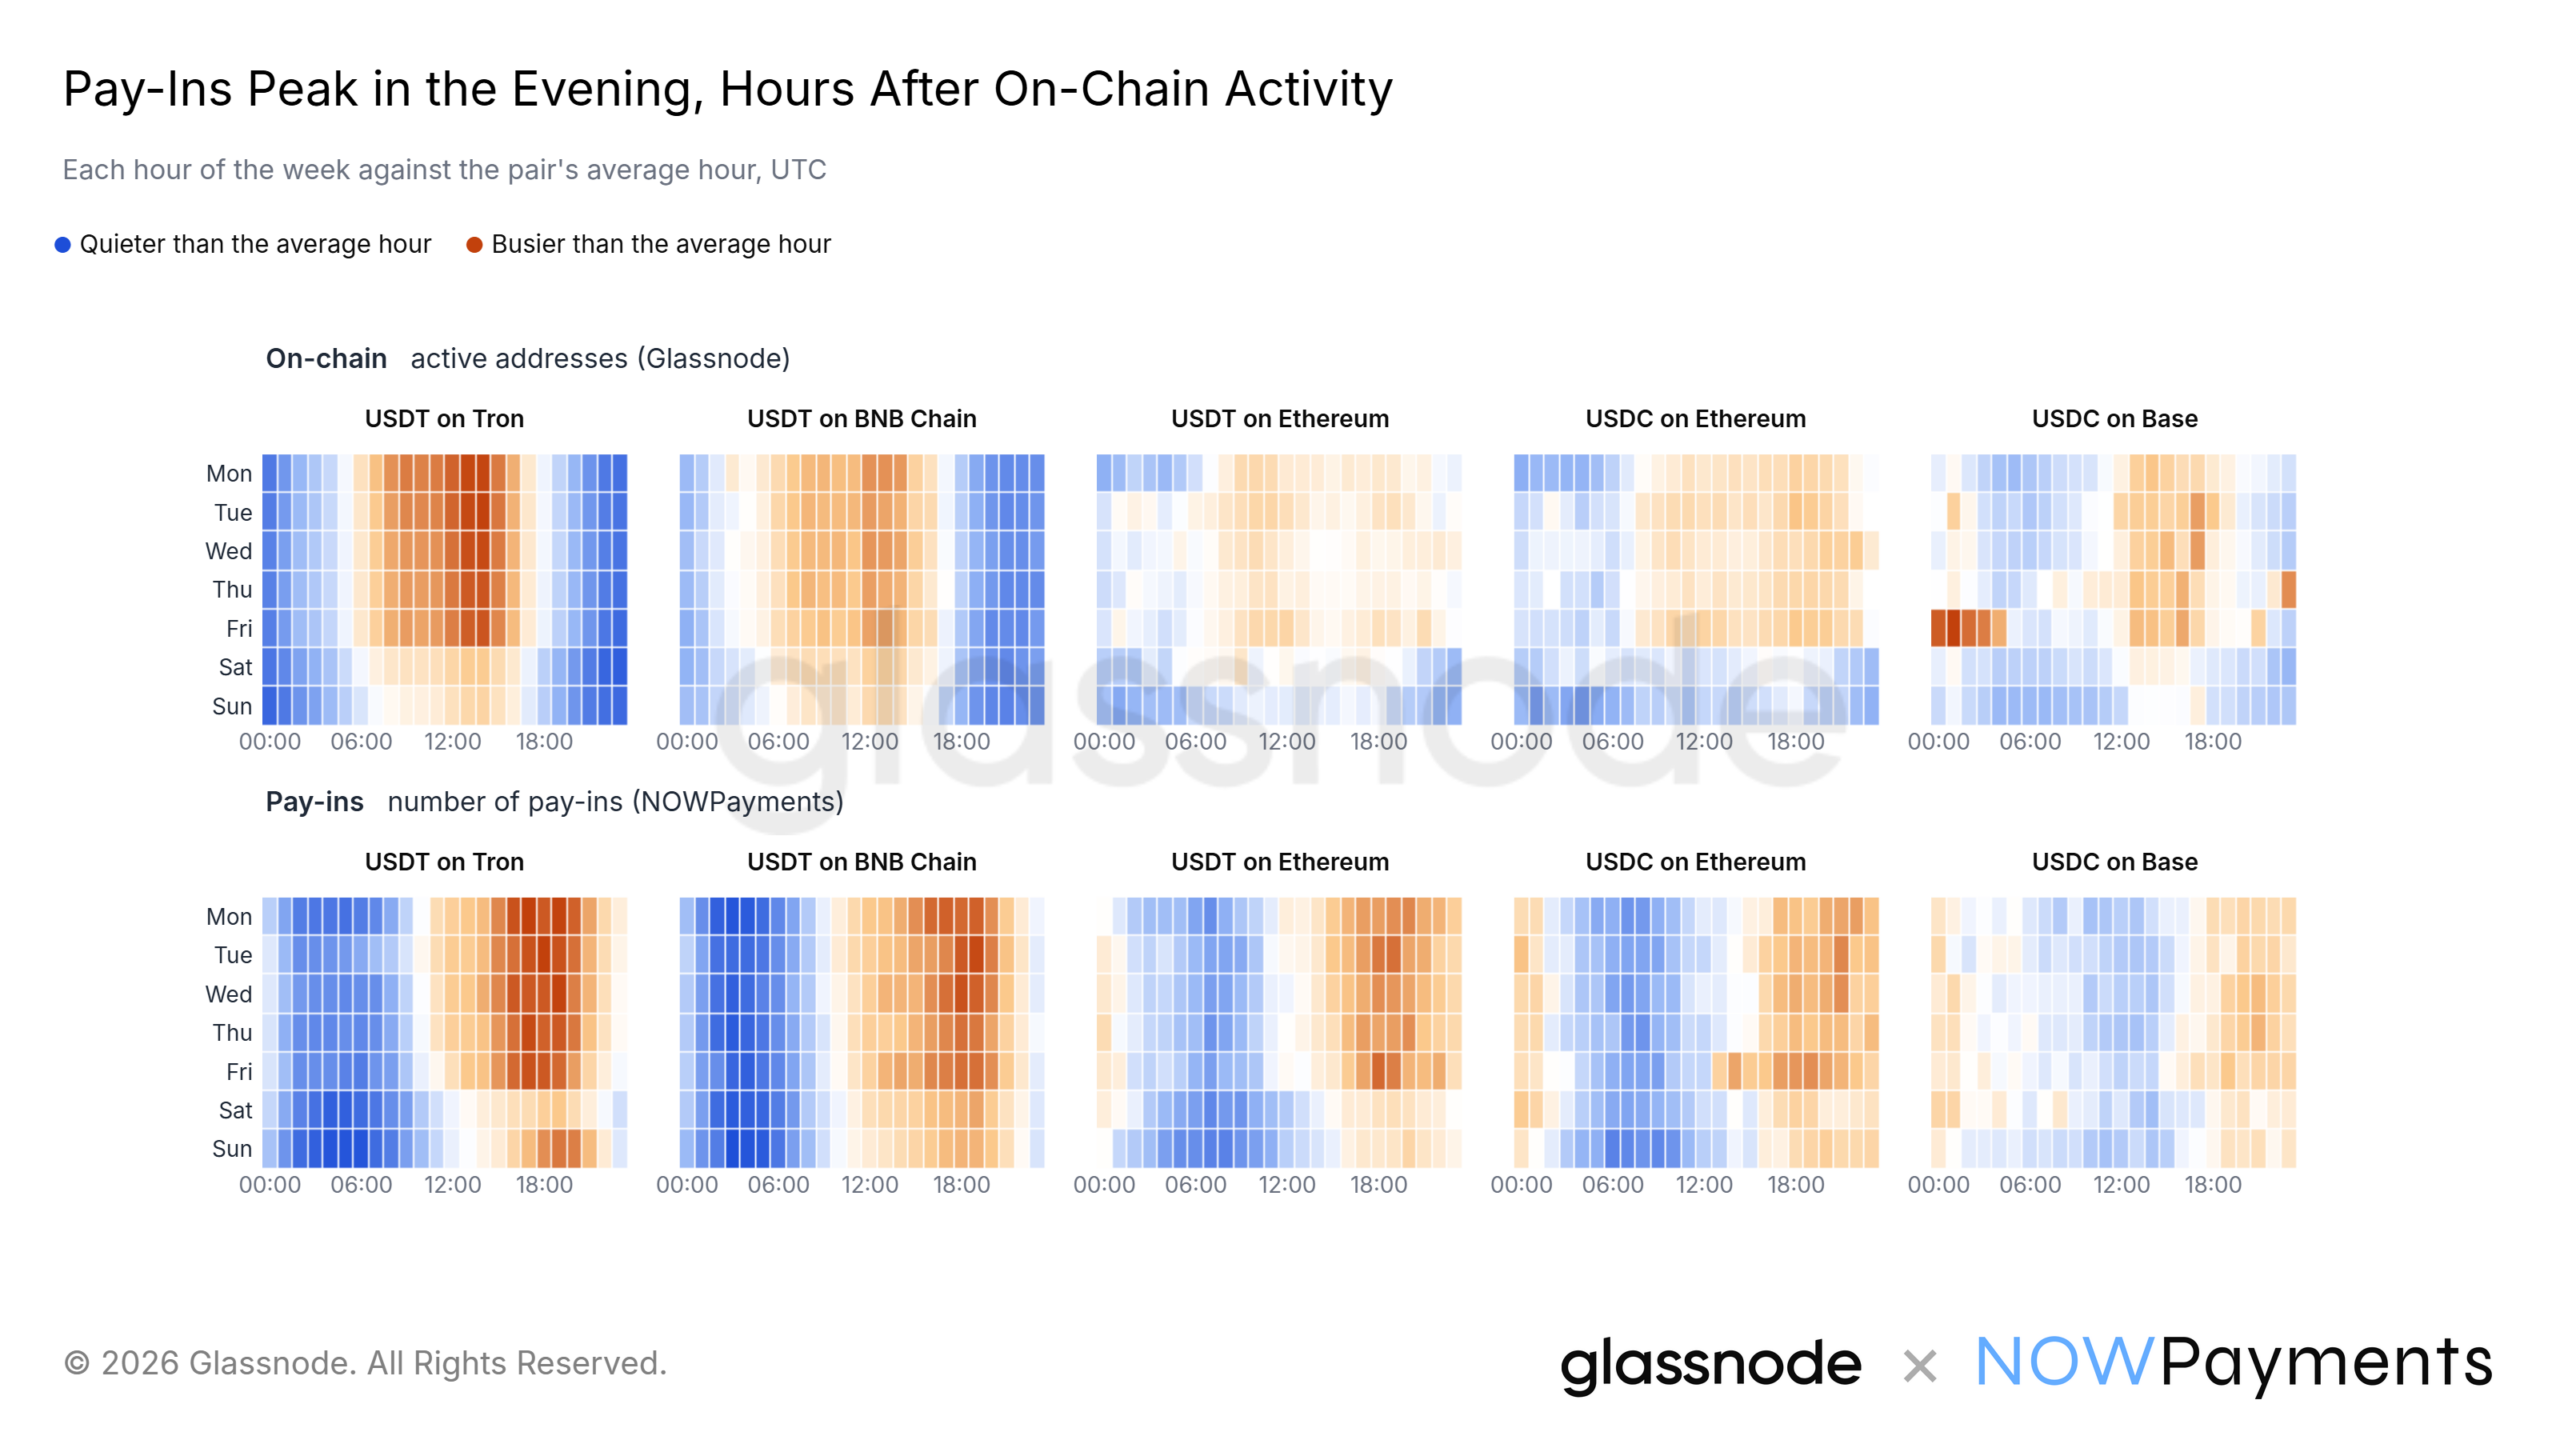
A separate metric is time of day, not price. TechFlow describes hourly data for the 39 complete weeks before 4 October 2026. Merchant receipt counts on the main channels generally peaked between 19:00 and 21:00 UTC — 03:00 to 05:00 the next calendar day in Beijing time (UTC+8) — several hours after the peak in on-chain active addresses.
The related figure shows, for five main stablecoin channels, the hourly distribution of on-chain active addresses above a UTC heatmap of merchant receipt counts, labeled through 4 October 2026. The briefing says offline and online merchants’ payment peaks do not coincide with the broader on-chain active period, so support and risk staffing would need to cover the receipt spike. That is an operations note in the source. It does not say anything about price or about when to trade.
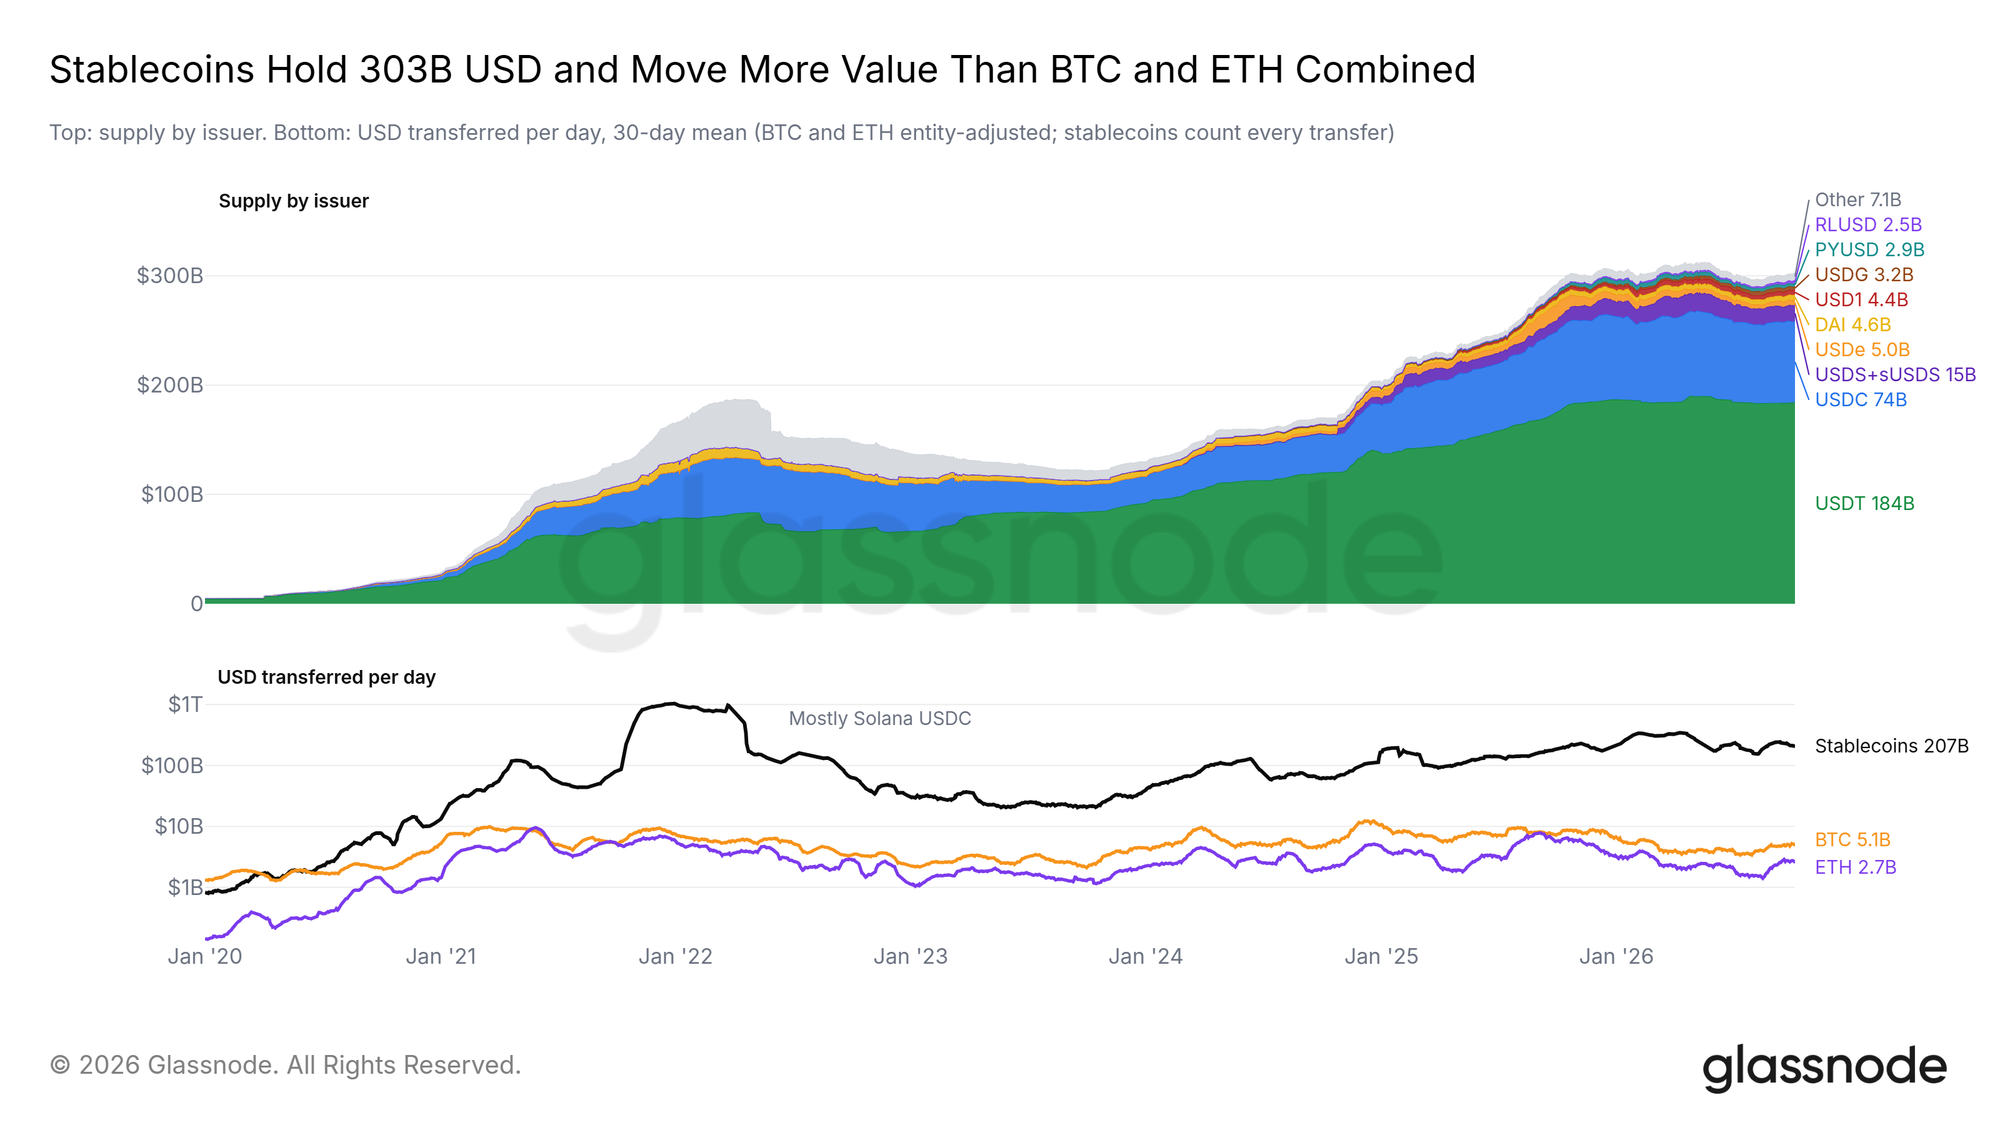
Supply and daily on-chain value on 5 October 2026
Observation date: 5 October 2026. Supply is a stock; the flow comparison is a 30-day average of daily on-chain transfer value.
- Total stablecoin supply had reached $303 billion, of which USDT was $184 billion and USDC was $74 billion. The summary does not list other issuers’ amounts.
- Daily on-chain transfer value, as a 30-day average, was $207 billion for stablecoins, $5.1 billion for Bitcoin, and $2.7 billion for Ethereum.
The dated comparison says the stablecoin average still exceeds Bitcoin and Ethereum even when every Bitcoin on-chain transaction is included. The article’s third figure pairs supply by issuer, marked at a $303 billion total, with that 30-day average daily dollar transfer comparison against BTC and ETH.
These supply and transfer readings are on-chain. They do not identify how much of the $207 billion was a customer paying a merchant. On the receipt evidence above, the chains that dominate this merchant sample are not the chains that dominate transfer value.
What the briefing says the PDF covers
TechFlow lists four areas in the full report and does not reproduce those breakdowns here: supply share by issuer, and why an ordinary blockchain transfer is not automatically a commercial payment; USDT versus USDC transfer-size distributions by chain, and differences in how often coins turn over; how many assets and networks a merchant would need in order to cover most payment sources, including differences among trading platforms, cross-border commerce, SaaS subscriptions, and online entertainment; and notes on choosing a settlement network, staffing around receipt peaks, and comparing explicit and implicit path costs. The article said the full PDF could be downloaded free. No PDF address is included in the supplied text.
Transfer-value rank, active-address mix, and merchant-receipt share are three different conditions in this snapshot, and they do not agree. None of them is a buy or sell threshold.
Source: Glassnode and NOWPayments, as summarized by TechFlow on 11 November 2026 at 09:55 (UTC+8). Original article.